
Flowcharts
A Flowchart is a diagrammatic (graphical) representation of an algorithm. Flowchart shows the steps defined in algorithm in sequential order with flow using symbols. Flowcharts are used to illustrate algorithms in order to aid in the visualization of an algorithm. Flowcharts are to be read top to bottom and left to right in order to follow an algorithms logic from start to end
Common Flowchart Symbols:
- Terminal (Start and Stop): Represents Start and End points.
- Process: Any Process is Represented by this symbol. (e.g., calculations).
- Input or Output: Represents Input/Output actions.
- Decision: Represents Decision points (yes/no or true/false paths).
- Flow Lines: Indicate the flow of control from one step to the next.
}})
}})
}})
}})
}})
Steps to Create a Flowchart:
- Identify the Steps: Based on the algorithm, determine each step.
- Select Symbols: Use appropriate symbols for each step.
- Arrange in Sequence: Position symbols logically and connect them with arrows.
- Test for Completeness: Ensure all possible paths are covered.
Examples
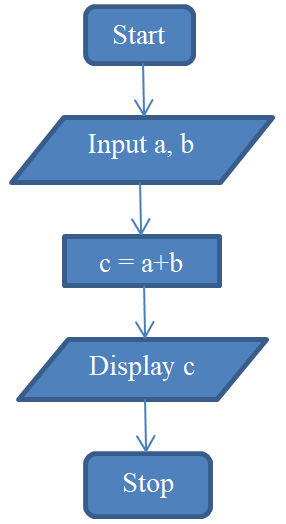
1.Finding the Sum of Two Numbers:
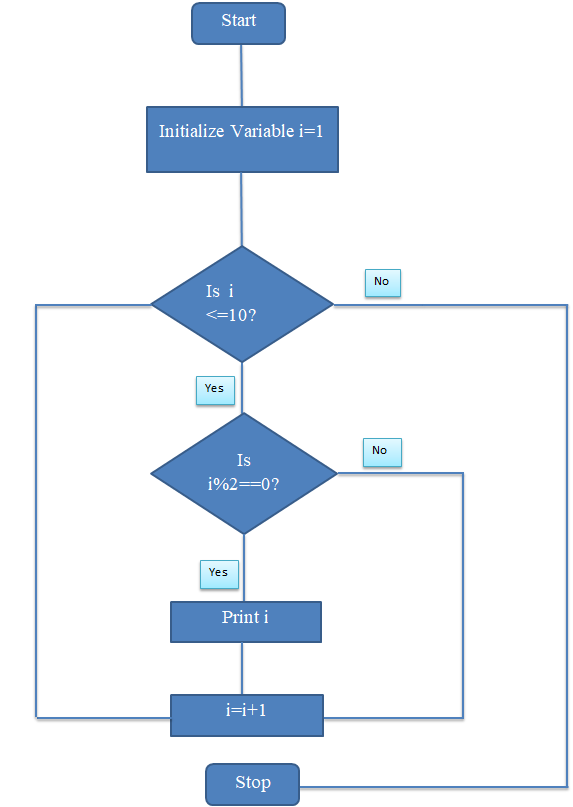
2.Flowchart for Even numbers from 1 to 10:
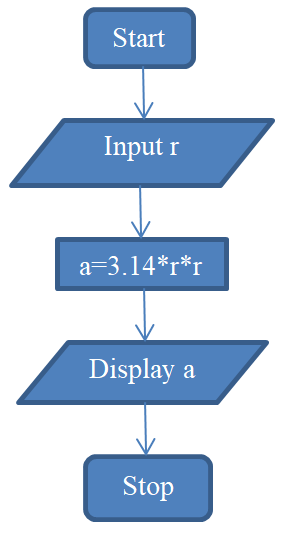
3.Flowchart for Area of a Circle:
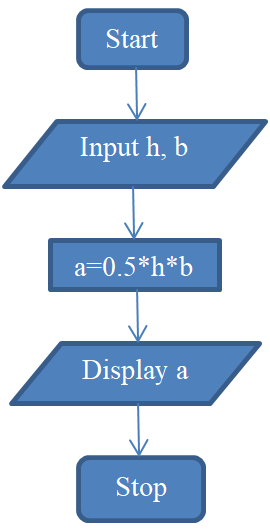
4.Flowchart for Area of a Triangle:
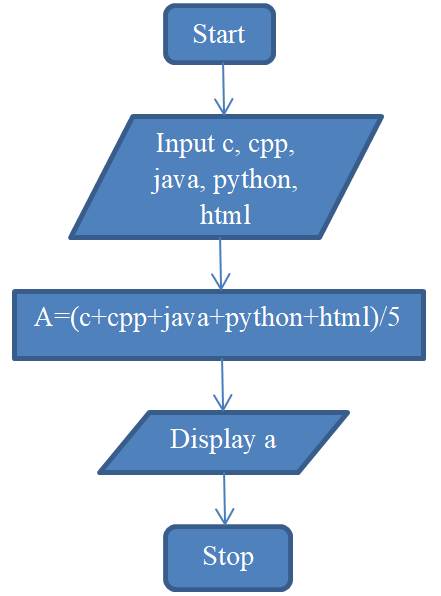
5.Flowchart for calculating Average of 5 subjects marks:
Flowcharts are beneficial because they:
- Provide a visual structure, making complex problems easier to understand.
- Help in debugging by tracing the flow of the program.
- Allow non-programmers to understand the logic of a solution.